The latter part of 2022 and early part of 2023 saw a lot of changes to the streets of Heaton. The end of October marked one year since the Safe Heaton trials were implemented. It also marked six months since the extension the protected cycle lanes on Heaton Road were completed.
With such significant milestones popping up on the SPACE for Heaton reminder calendar we decided to take a look at the available data to see what effect the changes have had.
Record Numbers Cycling in Heaton
The work to extend the protected cycle lanes on Heaton Road was completed at the end of April. The previously completed section that passes the shops on Heaton Road has had automatic counters recording the number of cycles passing through since May 2019. These counters give a good indication of whether cycle traffic is increasing or decreasing.
It’s important to note that the counters are in the cycle path. They won’t count people cycling on the road or people who miss the counter by joining after it. This means actual numbers could be higher.
All the indicators show that the changes have led to more trips being made by bike. In 2023 over 100,000 cycle trips have been counted on Heaton road up to the end of October. This is more than any previous year, with an average of over 330 trips per day being recorded.

Every individual month in 2023 except August also saw record numbers of cycle trips made too. July and August always show a dip in numbers of people cycling on Heaton Road. This likely reflects the school holidays. A return to school in September saw numbers rebound to levels far higher than the September before the extension was completed. Even the shorter, colder days of October have seen higher numbers of cycle trips each day than any previous year.

Daily cycle trips on Heaton Road in 2023 were 37% higher than their low point of 2021, which was at the hight of the Covid pandemic, and a period that saw record numbers of cycle trips being recorded across the country as a whole.
Since 2021 the national cycling index, which plots the level of cycling traffic across England against a 2013 baseline, has been decreasing slightly. Increasing numbers of trips on Heaton Road show that local numbers are going against the national picture. This could be because recent changes have encouraged more cycle trips in Heaton.

For more details on the cycling index visit https://www.gov.uk/government/statistics/cycling-index-england/cycling-index-england
Fewer Vehicles Passing Through Heaton
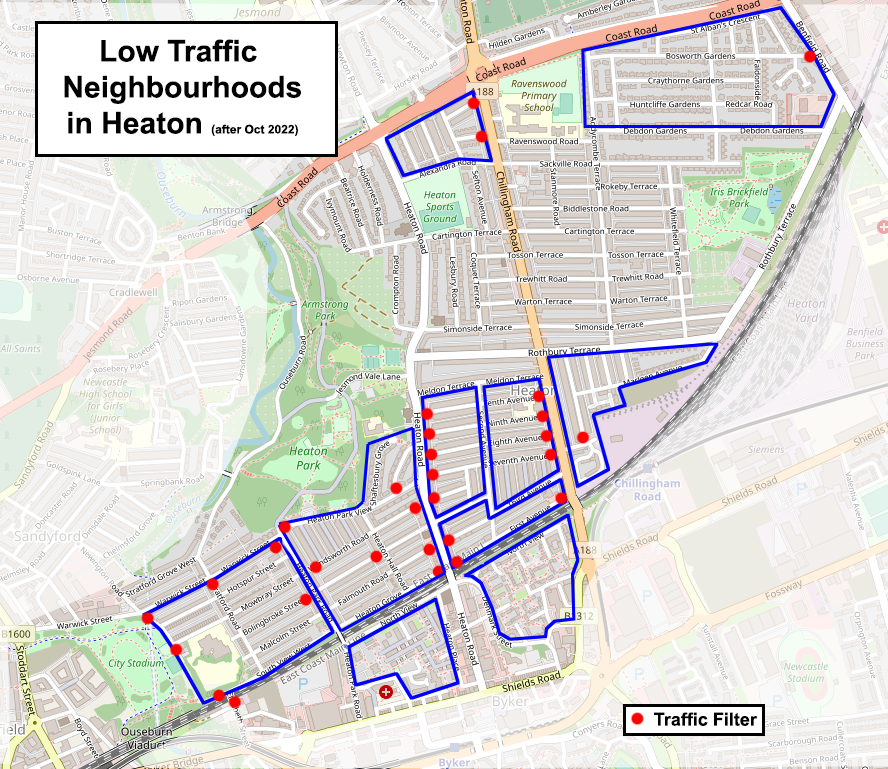
Before the cycle lanes on Heaton Road were completed the Safer Heaton scheme, aimed at reducing the amount of traffic travelling through Heaton, was implemented on a trial basis. The scheme added a number of modal filters to streets around Heaton Park Road.
Prior to the Safer Heaton trials being implemented there had been a number of long established low traffic areas in Heaton. However, the area between Heaton Park Road and Heaton Road was left unfiltered. Over time this had become a busy route for people getting to the Coast Road via Warwick Street and Heaton Road.

There would often be long queues of traffic along Heaton Park View and Heaton Road, all the way to the Coast Road.
The video below, recorded at 5:15pm on Thursday 23rd September 2021 shows what Heaton Road often looked like before the new filters were put in and before the cycle lanes on Heaton Road had been extended. Queues of traffic would often stretch from Heaton Park View to the Coast Road.
The changes brought the area between Heaton Park Road and Heaton Road in to line with other parts of Heaton. It is still possible to access anywhere in a car, but to travel through the area people now need to use the main roads or, if coming from further afield and passing through, use the quicker routes of the Coast Road or Byker Bypass.

Counting cars
There is a permanent traffic counter on Warwick Street, which gives a good indication of the number of vehicles travelling to and from Heaton via the Heaton Park Road area.
In the ten months to the end of October 2022, before the Safer Heaton changes were made Warwick Street saw almost 2 million vehicle trips, with an average number of 6538 vehicles each day using the narrow residential road. There was a roughly equal number of vehicles heading in each direction.
Since the changes were made to the streets around Heaton Park Road the number of vehicles heading in to and out of the area via Warwick street has reduced.
The ten months to the end of October 2023 saw approximately 144,000 fewer vehicles using Warwick Street than in the same period the year before the changes were made – almost 500 fewer vehicles each day.
Plotting the weekly change in traffic volume for Warwick Street shows that for the first 43 weeks of 2023 (up to the end of October) traffic heading to and from Heaton was lower than in 2022 for all but two weeks, with data not available for an additional one week.

After a post pandemic rise, the daily average number of vehicles on Warwick Street has fallen for the first time in two years. This suggests that the changes made in October 2022 have had the effect of reducing traffic traveling through Heaton.
Additionally, with close to 6000 vehicles still using Warwick Street daily, there doesn’t seem to be a problem with people who need to travel to the area being able to.
Disappearing Traffic
With Traffic on Warwick Street reduced, where are people going instead? The main alternative routes from people driving from the Central Motorway to the Coast Road or west side of Heaton are the Cradlewell Bypass or New Bridge Street and Byker Bridge.
Average daily traffic levels on the Cradlewelll Bypass (measured between the Jesmond Road and Corner House junctions) have been lower in 2023 than in 2022, suggesting that that route has not been adversely affected.

Average daily vehicle counts on Byker Bridge saw a small rise of 0.7%, or around 150 vehicles on average per day. This is a very small amount compared to the 22545 vehicles using the route on average each day in 2022 and the increase is smaller than the decrease in vehicles on Warwick Street. The Byker Bypass saw a slight fall in the average number of vehicles per day.

There isn’t a permanent counter on Heaton Road, so we will have to wait for the final reports from the Council which will hopefully contain counts from more streets for a detailed view on that. However, the queues previously seen stretching back from the Coast Road to and along Heaton Park View don’t seem to be happening anymore.
The video below was taken on the same day of the year and at the same time of day as the video above, just two years later, after the Safer Heaton trials had been implemented. The previous queues on Heaton Road have gone and Heaton Park View had very little traffic.
Persistent Problems
Despite the drop in traffic, it only takes a few dangerous drivers to make a street feel unsafe. The Safer Heaton scheme does appear to have reduced traffic, and the new crossing on Heaton Park Road has made walking and cycling routes safer.
However, unlike in some areas, the new filters don’t make the area fully impermeable to through traffic. Small numbers of drivers persist in cutting through, now driving down back lanes rather than following the main roads. Drivers emerging from back lanes and not looking for people walking along the pavements or cycling along the roads is a persistent problems, and driver standoffs can sometimes be seen when people going in opposite directions are unable to pass due to parked cars and the size of the vehicles they are driving.
These issues don’t indicate the scheme has failed in any respect, and local Councillors have been working to address the issues that have arisen.
An overall success
Overall we feel the Safer Heaton scheme has been a big improvement for Heaton, and the available data shows a drop in traffic which should be celebrated.
We are keen to see the remaining problems addressed and the Heaton Road cycle lanes extended up to and beyond the Corner House junction at the earliest opportunity.
Hopefully when this gets started the evidence showing the improvements brought about by the recent work will mean progress will be quicker than it has been in the past and Heaton can get a transport network that works for all people, not just those in car.