There are a number of air quality monitors placed around Heaton and the data collected by each device can be accessed via the Urban Observatory at Newcastle University.
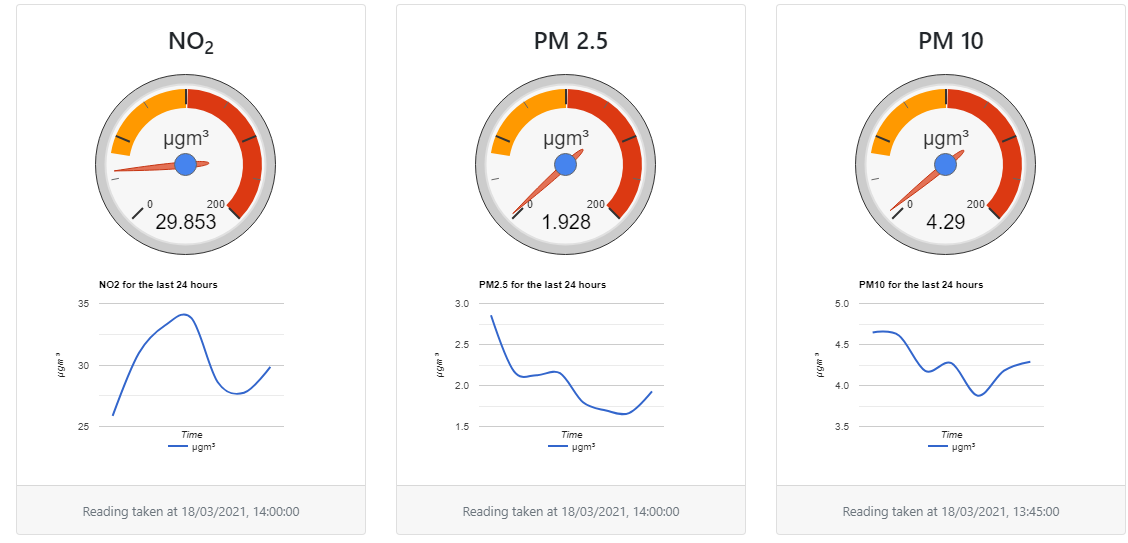
Now, to make it easier to find the sensors related to Heaton, we have created a dashboard to show the latest reading and readings for the past 24 hours for each of the local sensors. Where there is a CCTV camera near a monitor that has been included to.
Each of the monitors records the levels of NO2, with most of them also recording levels of particles in the air. In addition, the monitors also record temperature, air pressure and humidity.
The dashboard shows how levels rise and fall at different times of day as levels of traffic change, the amount of sunlight increases or decreases (sunlight breaks down NO2 in to other pollutants), and the weather changes.
What’s safe? What’s illegal?
The concentration of NO2 is recorded by the sensors in micrograms per metre cubed of air (µg/m³). While there is no safe level of any sort of pollutant there is a legal target for NO2 of an annual mean of 40 µg/m³. Additionally, a 1 hour mean average of 200 µg/m³ should not be exceeded more than 18 times a year.
The Government guide to safe levels various types of air pollution can be found on the DEFRA website (pdf) along with a useful guide explaining what the targets mean in terms of UK and EU limits.
At a later date we will investigate adding the mean average values to the dashboard.
Other data
As well as the air quality monitors traffic counts and speed records collected in June 2017 have been added to the site and all the three most recent images from CCTV cameras in and around Heaton can also be seen.
View the dashboard
Visit the dashboard at https://sensors.spaceforheaton.com