Recently, after a long gap, TADU (Transport Analysis Data Unit) has been updated with traffic count data for 2024 and the start of 2025. This means it’s now it’s possible to see what effect the removal of the Safer Heaton scheme had on the level of traffic heading through Heaton.
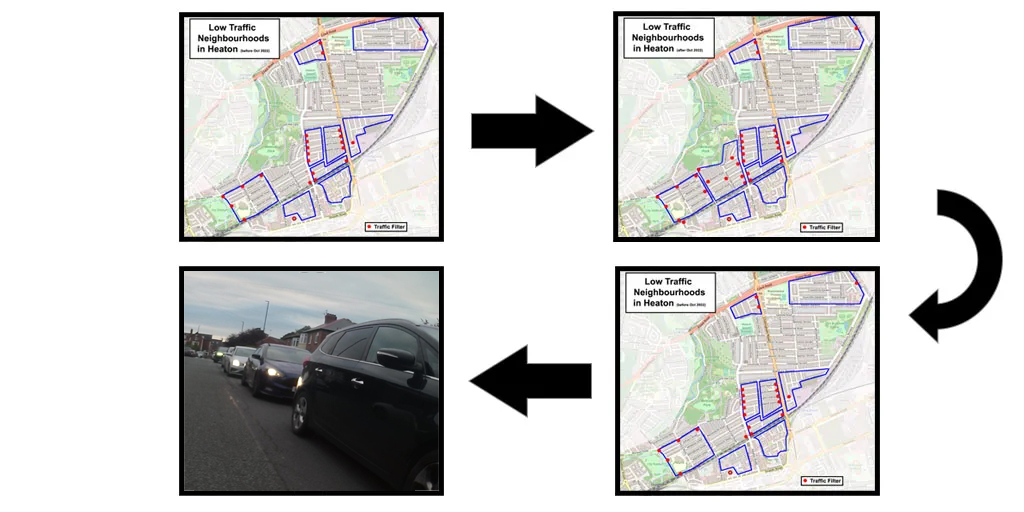
To recap, a number of streets were filtered in October 2022. You can read about the changes that were made in our post about the scheme.
After the filters were put in place comparing data from the start of 2022 to the start of 2023 collected from Warwick Street – outside the filtered area but leading towards it – showed that the number of vehicles heading to and from Heaton via narrow residential streets dropped by an average of almost 500 per day, and that most weeks after the filters were put in place had lower traffic levels that the same week in the year before the filters were installed.

Unfortunately the quieter streets weren’t to last. After a change of leadership at the Council the filters in Heaton, as well as similar schemes in Fenham and Jesmond, were removed in 2024.
Now we are in the latter half of 2025 and have updated traffic counts we can compare the traffic in the area for the first few months of this year with the traffic that was in the area while the filters were in place, as well as the same period before the filters were in place.
Unsurprisingly, the resulting chart is almost a mirror image of the chart created after the filters were installed. Traffic was higher almost every week over the first 29 weeks of the year.

Looking at the average daily vehicle count over the first 29 weeks of the years before, during and after the filters were in place shows the effect they had very clearly.

The Council’s Cabinet recently agreed a new Movement Strategy Framework for 2025 to 2045. Key insights from the document detail how 45% of journeys in the North East are less than two miles and that more than a third of households in the city don’t own a car.
In the coming months an implementation strategy is due to be produced that will detail how the council intends to implement the Movement Strategy. Will it include proven techniques to keep through traffic on main roads and keep narrow residential streets safe for people walking and cycling? We’ll need to wait and see.